Basics of Machine Learning Series
What are Skewed Classes?
Skewed classes basically refer to a dataset, wherein the number of training example belonging to one class out-numbers heavily the number of training examples beloning to the other.
Consider a binary classification, where a cancerous patient is to be detected based on some features. And say only \(1\ %\) of the data provided has cancer positive. In a setting where having cancer is labelled 1 and not cancer labelled 0, if a system naively gives the prediction as all 0’s, still the prediction accuracy will be 99%.
% naive prediction ignoring features
def predict_cancer(x):
    return 0
Therefore, it can be said with conviction that the accuracy metrics or mean-squared error for skewed classes, is not a proper indicator of model performance. Hence, there is a need for a different error metric for skewed classes.
Precision/Recall
Note: \(y = 1\) is ther rarer class among the two.
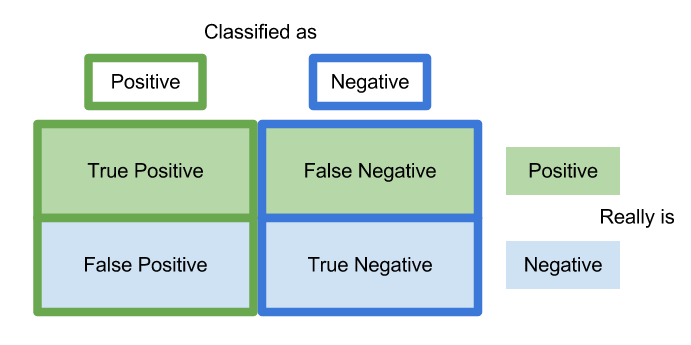
In a binary classification, one of the following four scenarios may occur,
- True Positive (TP): the model predicts 1 and the actual class is 1
- True Negative (TN): the model predicts 0 and the actual class is 0
- False Positive (FP): the model predicts 1 but the actual class is 0
- False Negative (FN): the model predicts 0 but the actual class is 1
Then precision and recall can be defined as follows,
Precision defines of all the predictions \(y=1\), which ones are correct.
Recall defines of all the actual \(y=1\), which ones did the model predict correctly.
Now, if we evaluate a scenario where the classifier predicts all 0’s then the recall of the model will be 0, which then points out the inability of the system.
In case of skewed classes, it’s not possible for the classifiers to cheat the evaluation metrics of recall and precision. Also, it is important to note that precision and recall metrics work better if \(y=1\), denotes the presence of the rarer class.
The Tradeoff
By changing the threshold value for the classifier confidence, one can adjust the precision and recall for the model.
For example, in a logistic regression the threshold is generally at 0.5. If one increases it, we can be sure that of all the predictions made more will be correct, hence, high precision. But there are also higher chances of missing the positive cases, hence, the lower recall.
Similary, if one decreases the threshold, then the chances of false positives increases, hence low precision. Also, there is lesser probability of missing the actual cases, hence high recall.
A precision-recall tradeoff curve may look like one among the following,
F Score
Given two pairs of precision and recall, how to choose the better pair. One of the options would be to choose the one which higher average. That is not the ideal solution as the pair with \((precision=0.02 and recall= 1)\) has a better mean than the pair \((precision=0.5 and recall= 0.4)\).
Enter \(F\,Score\) or \(F_1\,Score\), which is the harmonic mean of precision and recall, defined as,
The above formula has advantage over the average method because, if either precision or recall is small, the the numerator product \(P*R\) will weigh the F-Score low and consequently lead to choosing the better pair of precision and recall. So,
- if \(P=0\) or \(R=0\), then \(F_1=0\)
- if \(P=1\) and \(R=1\), then \(F_1=1\)
One reasonable way of automatically choosing threshold for classifier is to try a range of them on the cross-validation set and pick the one that gives the highest F-Score.
Sensitivity/Specifivity
Apart from precision and recall, sensitivity and specifivity are among the most used error metrics in classfication.
- Sensitivity or True Positive Rate (TPR) is another name for recall and is also called hit rate
- Specifivity (SPC) or True Negative Rate
Using Large Datasets
Although, its been stated here that for a high bias problem in the model, gathering more and more data will not help the model improve.
But under certain conditions, getting a lot of data and training on a certain type of training algorithm can be an effective way to improve the learning algorithm’s performance.
The following are the conditions that should be met for the above statement to hold true,
- The features, \(x\), must have sufficient information to predict \(y\) accurately. One way to test this would be to check if human expert can make a confident predition using the features.
- Using a learning algorithm with a large number of parameters to learn (e.g. logistic regression, linear regression, neural network with many hidden units etc.). What this truly accomplishes is that these algorithms are low bias algorithm due to the large number of learnable parameters.
In such settings, where the problem of high bias is removed by the virtue of highly parametrized learning algorithms, a large dataset ensures the low variance. Hence, under the listed settings a large number of dataset is almost always going to help improve the model performance.
It’s not who has the best algorithm that wins, it’s who has the most data.
REFERENCES:
Machine Learning: Coursera - Error Metrics for Skewed Classes
Machine Learning: Coursera - Trading off Precision and Recall
Machine Learning: Coursera - Data for Machine Learning
Sensitivity and Specifivity - Wikipedia