Basics of Machine Learning Series
Introduction
- K-means clustering is one of the most popular clustering algorithms.
- It gets it name based on its property that it tries to find most optimal user specified k number of clusters in a any dataset. The quality of the dataset and their seperability is subject to implementation details, but it is fairly straight forward iterative algorithm.
- It basically involves a random centroid initialization step followed by two steps, namely, cluster assignment step, and centroid calculation step that are executed iteratively until a stable mean set is arrived upon. It becomes more clear in the animation below.
- Cluster Assignment: Assign each data point to one of the two clusters based on its distance from them. A point is assigned to the cluster, whose centroid it is closer to.
- Move Centroid: After cluster assignment, centroids are moved to the mean of clusters formed. And then the process is repeated. After a certain number of steps the centroids will no longer move around and then the iterations can stop.
K-Means Algorithm
Input:
- \(K\), number of clusters
- Training set, \(x^{(1)}, x^{(2)}, \cdots, x^{(m)}\)
where:
- \(x^{(i)} \in \mathbb{R}^n\), as there are no bias terms, \(x_0=1\)
Algorithm:
- Randomly initialize \(K\) cluster centroids, \(\mu_1, \mu_2, \cdots, \mu_k \in \mathbb{R}^n\)
- Then,
It is common to apply k-means to a non-seperated clusters. This has particular applications in segmentation problems, like market segmentation or population division based on pre-selected features.
Optimization Objective
Notation:
- \(c^{(i)}\) - index of cluster \(\{1, 2, \cdots, K\}\) to which example \(x^{(i)}\) is currently assigned
- \(\mu_k\) - cluster centroid \(k\), \(\mu_k \in \mathbb{R}^n\)
- \(\mu_{c^{(i)}}\) - cluster centroid of the cluster to which the example \(x^{(i)}\) is assigned
Following the above notation, the cost function of the k-means clustering is given by,
Hence the optimization objective is,
The cost function in \eqref{2} is called distortion cost function or the distortion of k-means clustering.
It can argued that the k-means algorithm in \eqref{1}, is implementing the cost function optimization. This is so because the first step of k-mean clustering, i.e. the cluster assignment step is nothing but the minimization of the cost w.r.t. \(c^{(1)}, c^{(2)}, \cdots, c^{(m)}\) as this step involves assigning a data point to the nearest possible cluster. Similarly the second step, i.e. moving the centroid step is the minimization of the clustering cost w.r.t. \(\mu_1, \mu_2, \cdots, \mu_K\) as the most optimal position of centroid for minimizing the distortion for a given set of points is the mean position.
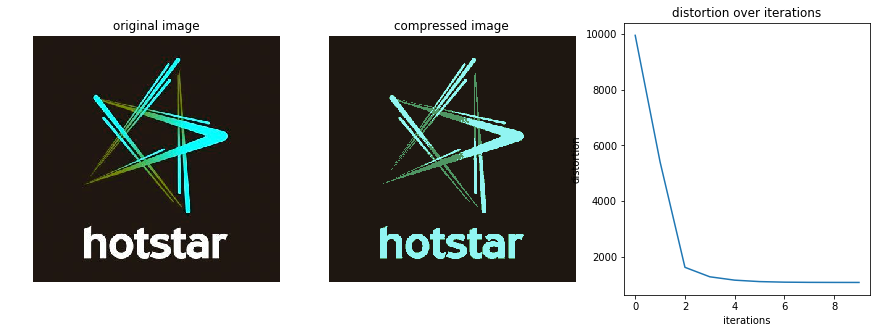
One handy way of checking if the clustering alorithm is working correctly is to plot distortion as a function of number of iterations. As both the steps in the k-means are calculated steps for minimization it is always going to decrease or remain approximately constant as the number of iterations increase.
Random Initialization
There are various ways for randomly picking out \(K < m\) cluster centroids, but the most recommended one involves picking \(K\) randomly picked training examples and initialize \(\{\mu_1, \mu_2, \cdots, \mu_K\}\) equal to these \(K\) examples.
Based on initialization, it is possible that k-means could converge to different centroids or stuck in some local optima. One possible solution to this is to try multiple random initializations and then choose the one with the least distortion. It’s fairly usual to run k-means around 50-1000 times with random initialization to make sure that it does not get stuck in local optima.
Generally the trick of multiple random initializations will help only if the number of clusters is small, i.e. between 2-10. For higher number of clusters the multiple number of random initializations are less likely to help improve the distortion cost function.
Choosing the Number of Clusters
- One way of choosing the number of clusters is by manually visualizing the data.
- Sometimes it is ambiguous as to how many clusters exist in the dataset and in such cases it’s rather more useful to choose the number of clusters on the basis of end goal or the number of clusters that serve well the later down stream goal that needs to be extracted from the datasets.
- Elbow Method: On plotting the distortion as a function of number of clusters, \(K\), this methods says that the optimal number of cluster at the point the elbow occurs as can be seen for line B in the plot below. It is a reasonable way of choosing the number of clusters. But this method does not always work because the sometimes the plot would look like line A which does not have clear elbow to choose.
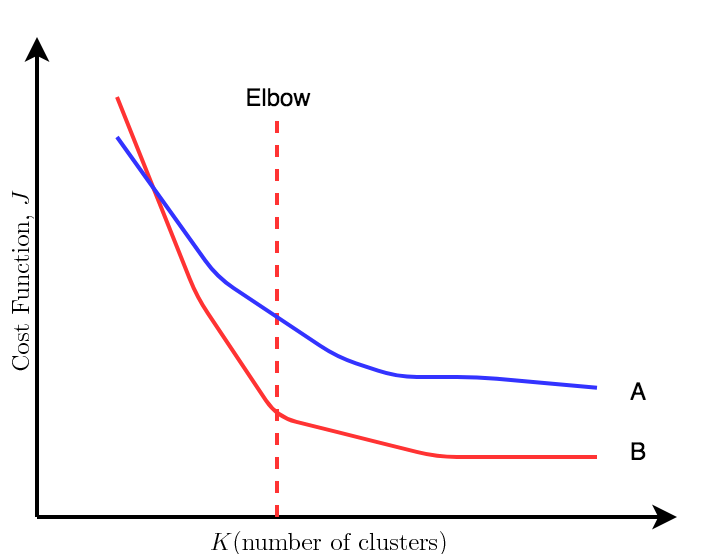
As a strict rule in k-means, as the number of cluster \(K\) increases, the distortion would decrease. But after some point the increase in cluster would not give much decrease in the distortion.
Example
import cv2
import matplotlib.pyplot as plt
import numpy as np
Given a image it is reshaped into a vector for ease of processing,
l, w, ch = img.shape
vec_img = img.reshape(-1, ch).astype(int)
Following this K points are randomly chosen and assigned as centroids,
def choose_random(K, vec):
    m = len(vec)
    idx = np.random.randint(0, m, K)
    return vec[idx]

mu = choose_random(K, vec_img)
The two basic steps of k-means clustering, cluster assignment and moving centroids can be implemented as follows,
def cluster_assignment(mu, vec):
    return ((vec - mu[:, np.newaxis]) ** 2).sum(axis=2).argmin(axis=0)

def move_centroid(mu, c, vec):
    for i in range(len(mu)):
        vec_sub = vec[c==i]
        mu[i] = np.mean(vec_sub, axis=0)
    return mu
The distortion cost fuction is calculated as follows,
def distortion(mu, c, vec):
    return ((mu[c] - vec) ** 2).sum() / vec.shape[0]
Once all the modules are in place, k-means needs to iterate over the steps of cluster assignment and moving centroids until the distorion is within the threshold (threshold chosen = 1),
last_dist = distortion(mu, c, vec_img) + 100
curr_dist = last_dist - 100

while last_dist - curr_dist > 1:
    last_dist = curr_dist
    c = cluster_assignment(mu, vec_img)
    mu = move_centroid(mu, c, vec_img)
    curr_dist = distortion(mu, c, vec_img)
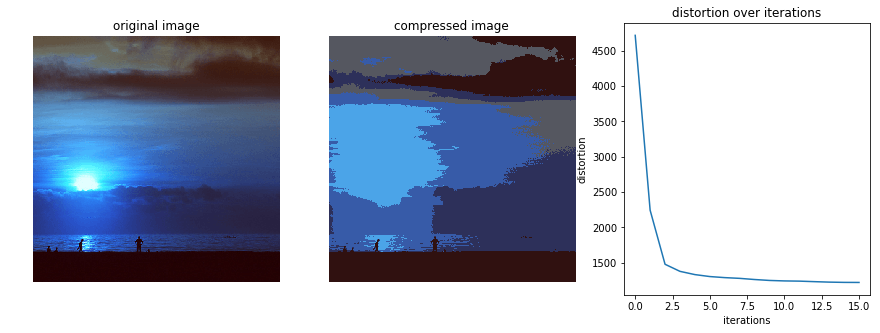
Following plots are obtained after running k-means for image compression on two different images,
Following code implements k-means for different values of K.
def elbow(img):
    K_hist = []
    dist_hist = []
    for K in tqdm(range(1, 10)):
        K_hist.append(K)
        mu, c, dist = k_means(img, K, plot=False)
        dist_hist.append(dist)
    plt.plot(K_hist, dist_hist)
    plt.xlabel("K")
    plt.ylabel("final distortion")

plt.figure(figsize=(15, 5))
plt.subplot(1, 2, 1)
plt.title('elbow plot of image 1')
elbow(img_1)
plt.subplot(1, 2, 2)
elbow(img_2)
plt.title('elbow plot of image 2')
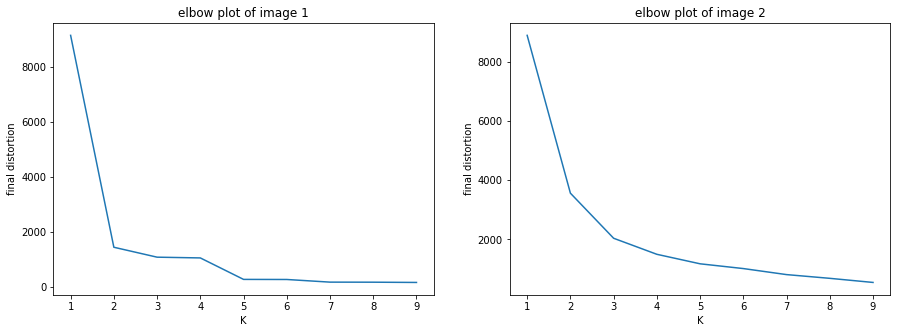
Seeing the two plots it is evident while the elbow plot gives a optimal value of two for image 1, there is no well defined elbow for the image 2 and it is not very clear which value would be optimal as mentioned in the section above.
REFERENCES:
Machine Learning: Coursera - K-Means Clustering
Machine Learning: Coursera - Optimization Objective
Machine Learning: Coursera - Random Initialization
Machine Learning: Coursera - Choosing the number of clusters